Auto Insurance Claims Platform: three questions every insurer needs to answer
In Mexico, roughly 70% of vehicles circulate without insurance. For the insurers covering the rest, the business boils down to three questions: how much to charge, how much to reserve, and where the fraud is. This platform builds a dashboard that answers all three with data calibrated to the Mexican market, separating frequency from severity for pricing, estimating what remains unpaid with two complementary methods, and flagging anomalous claims before they reach adjustment.
In Mexico, roughly 70% of vehicles circulate without insurance. For the insurers covering the remaining 30%, the business boils down to three questions: how much to charge for each policy, how much to reserve for claims that haven’t been reported yet, and which claims deserve investigation before being paid. This project builds a dashboard that answers all three.
The data
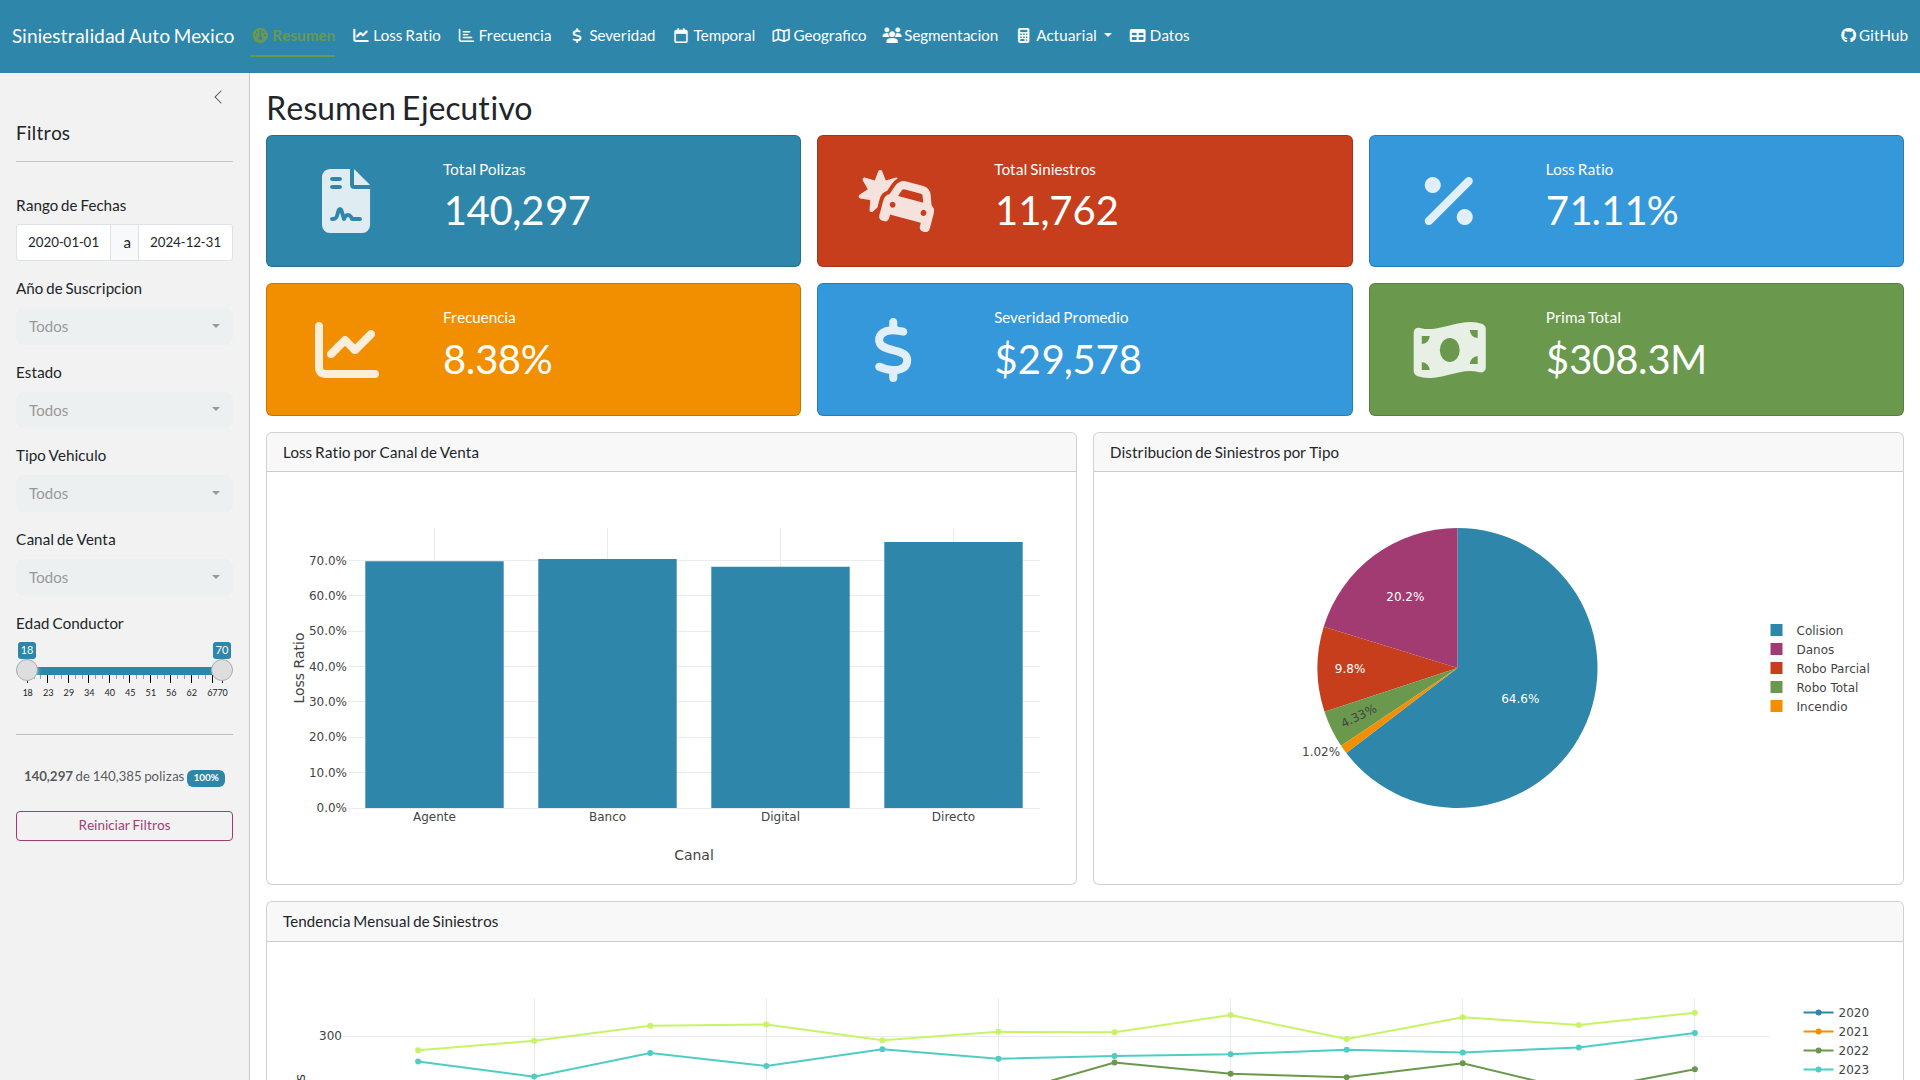
The portfolio is synthetic, but the parameters come from real sources. Claims frequency, average severity, and the target loss ratio are calibrated with public data from CONDUSEF and AMIS. The claims type distribution follows the typical Mexican auto pattern: collision as the dominant event, followed by damage, partial theft, total theft, and fire as the tail. The development pattern uses the short tail characteristic of auto, where most payments concentrate in the accident year.
The KPIs the portfolio produces are consistent with the market: the loss ratio lands close to the sector target, and the severity deviation reflects cumulative inflation over the simulation period. If the parameters were invented, those indicators wouldn’t align.
The portfolio covers several Mexican states, multiple brands and models, and three vehicle types. What matters here is that the geographic and vehicular diversity allows the pricing model to capture real risk signals.
Pricing: separating frequency from severity
In auto insurance, a driver who crashes frequently and one who has a single expensive claim represent different risks. The pricing model separates these two dimensions because they respond to different factors: frequency depends on driving habits and geographic zone; severity depends on vehicle value and coverage type.
What surprised me most was how much geographic zone dominates. Young drivers generate a significant surcharge, SUVs another, but high-risk zones like CDMX and Estado de Mexico reach a surcharge comparable to age. Zone matters as much as driver age, and both matter more than vehicle type. This aligns with AMIS theft statistics: theft is concentrated in those two states, and the model captures that signal clearly.
The interactive quoter calculates the premium in real time from any insured’s profile. You can inspect how each risk factor (age, zone, vehicle, channel) accumulates into the final price through a waterfall decomposition.
Reserves: estimating what remains unpaid
Auto claims have a useful property: they develop fast. Most payments occur in the accident year, and by the fourth year everything is settled. That short tail makes it reasonably possible to estimate how much remains unpaid from claims that already happened but haven’t been reported yet.
The platform uses two methods in parallel. The first projects from how payments have historically developed: if prior years show that 85% was paid by the first development, that pattern gets applied to more recent years. The second blends that projection with a prior expectation of the loss ratio, making it more stable in recent years where data is scarce and each individual claim moves the result substantially.
The interface shows the full development triangle and allows comparing both methods’ estimates side by side by accident year. Where they diverge most is exactly where having both adds the most value: in immature years.
This connects to SIMA, which handles life insurance reserves. Both platforms use the same estimation mechanics, but the resemblance ends there. Auto claims develop over four years; life claims extend for decades. The tail lengths are incommensurable.
Stress testing: what happens if the world gets worse
The scenario module simulates thousands of possible futures for the portfolio, varying claims frequency (what happens if there are more accidents) and severity (what happens if claims cost more, for example due to inflation). Each run produces a loss distribution that lets you answer questions like: at the 99.5% confidence level, what is the worst expected loss.
The CNSF requires a specific tail risk measure for solvency capital (RCS) calculations: the average of losses exceeding a given threshold. The dashboard uses it as the primary measure because that is what an actuary needs to report.
The visualizations layer the baseline loss distribution against the stressed scenario, with an exceedance curve showing the cumulative tail. The value is in being able to move the parameters and see in real time how the portfolio’s risk profile changes.
Fraud detection: identifying the anomalous
Fraud is detected through two channels that combine into a single score. The first is statistical: for each claim type, the model measures how far each claim sits from the portfolio’s typical behavior, considering amount, reporting delay, and deductible. A claim that deviates substantially from the normal pattern across several dimensions simultaneously warrants attention.
The second channel is rule-based: multiple claims on the same policy in a short window, claims filed right after purchasing the policy, amounts well above the median for that claim type, unusual reporting delays, or amounts close to the sum insured. Each rule votes independently.
The composite score combines both channels. What the statistical distance captures (subtle patterns an adjuster wouldn’t see in a table) and what the rules capture (structural signals that the sector’s operational experience knows well) complement each other. Neither is sufficient alone.
What I learned
The variable that most affects pricing in the Mexican auto market is geographic zone, above driver age or vehicle type. CDMX and Estado de Mexico accumulate the highest frequency and severity.
The practical difference between the two reserve methods surfaces in recent accident years. The first amplifies the volatility of early data; the second anchors to the prior expectation and smooths the noise. For auto with its short tail, the divergence is modest. In long-tail liability, the difference would be dramatic.
One limitation worth naming: the data is entirely synthetic. Variable correlations are by design. A real dataset from AMIS or CONDUSEF would reveal patterns and interactions that don’t exist in generated data. The next step would be obtaining public datasets or negotiating a data-sharing agreement with a real insurer to retrain the models on market data.
Repository: github.com/GonorAndres/CarteraSeguroAutos
Live app: cartera-autos on Cloud Run